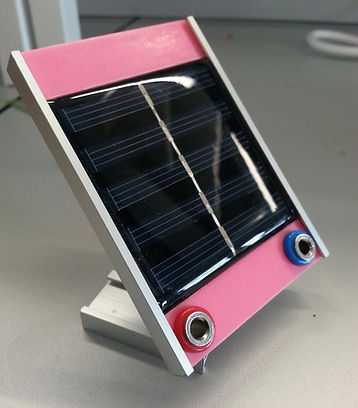
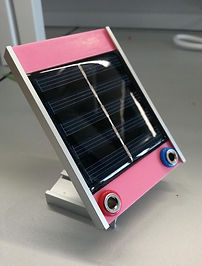
The CK80 PV module was chosen for modelling, as its material (polycrystalline) is well-used in the market and it is well-suited to traditional applications of photovoltaics. The CK80 module has 6 series connected polycrystalline silicon cells and provides 0.155 watt of nominal maximum power. The key specifications are shown below.
Modelling and Simulation of a Solar Photovoltaic System using Matlab/Simulink
Summary
As the concerns arose about the use of fossil fuels contributing the global warming and the demand of electricity escalated, this project presents the implementation of a generalised photovoltaic (PV) simulation model using MATLAB and Simulink interface. The project presents an analysis of single-diode equivalent circuit model to develop a particular PV model based on mathematical equations by using Simulink. This model can be used for building a photovoltaic circuit model for any photovoltaic array and allows the prediction of PV cell behaviour under different environmental parameters. The proposed model is a reliable and low-cost solution, which will be also assisted the developers to effectively design and create large scale photovoltaics system in a quick and secure way. In order to validate the developed model, an experiment test was built and exhibited a good agreement between the measured and simulation results values.
How this system can be used?
This mathematical models accurately reflects some behaviour of a real-photovoltaic system of interest to gain a better understand the interrelation between design and performance parameters through analysis of the model. This model can be used to:
-
to find out the most important factors in the process of building the PV system, which leads to identify potential problem areas

-
purchase PV modules
-
offer new possibilities to manage, predict and simulate the increasing complexity of technology
MATHEMATICAL MODELLING
Method of modelling
MATLAB and Simulink is a tool for mathematical modelling of the solar cell.
SIMULINK MODEL
1. Step 1
The subsystem 1 is created to convert the module operating temperature given in Celsius to Kelvin. This block is used to control the input temperature of the PV module.
Standard test conditions (STC)
These are defined as a set of standard conditions under which all the PV cells are tested and specification given. Standard test conditions is commonly used in order to compare the different cells and modules. These conditions are 1000W/m² irradiance, air mass of 1.5 and a cell temperature of 25°C.
Figure 3: Specification sheet of CK80 Module
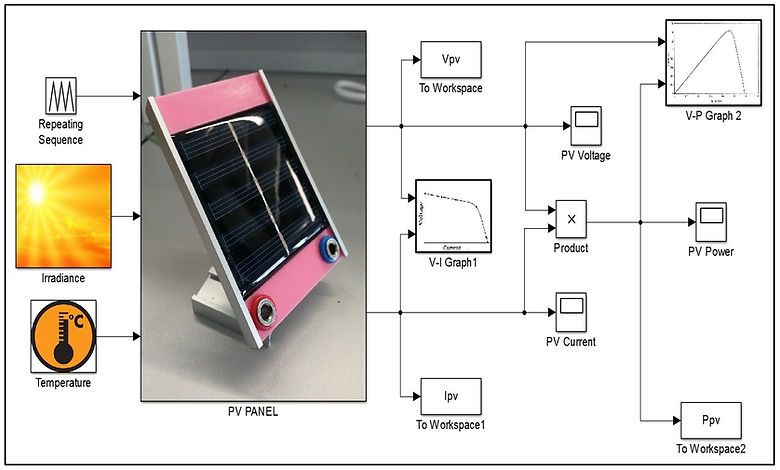
Figure 1: Schematic flow of modelling process


Figure 5: Subsystem 1
Figure 6: The circuit under subsystem 1
Figure 11: Subsystem 4
2. Step 2
4. Step 4
3. Step 3


Figure 9: Subsystem 3
Figure 10: The circuit under subsystem 3
Figure 12: The circuit under subsystem 4

Figure 7: Subsystem 2
Figure 8: The circuit under subsystem 2

Figure 13: Subsystem 5
5. Step 5

6. Step 6
Figure 14: The circuit under subsystem 5

7. Step 7
All the six subsystems which are modelled as the previous steps are interconnected together with the appropriate input and output
Figure 18: The final mathematical model for PV system

Figure 15 : Subsystem 6
Figure 16: The circuit under subsystem 6
Figure 17: Interconnection of the six subsystems
Results of Simulink Model
a) Performance estimation of the simulated model
The performance of the simulated is set up at the standard test conditions, which the input irradiance of 1 000W/m² and the temperature of 25°C.


The simulation gives Nominal Power of 154.5 mWp or approximately of 0.155 Wp.
To calculate the efficiecny of the developed model:
So the efficiency of the developed model is 5.1%.
b) Analysis
Figure 19: I-V Curves of Simulated Model
Figure 20: P-V Curves of Simulated Model

8. Step 8
Figure 2
Figure 27: The setup picnic basket
Figure 30: Schematic 1 for the experimental test
b) Limitation of the experimental test
The test did not take into account of the temperature effect on the experimental test. The test was conducted at the temperature of 13°C (given by BBC on that day), which is not the standard test conditions. Moreover, the light is only provides maximum 90 W/m², which is one of the limitation of this experiment. When using a 20 Watt halogen light for testing purposes, the output voltage may measure less than three-fourths of the maximum voltage.
c) Procedure

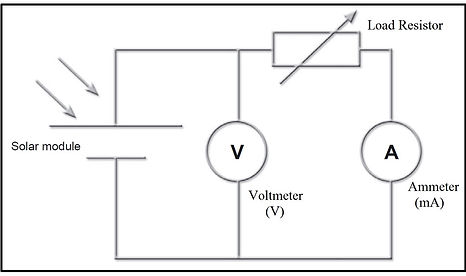
Figure 29: Circuit diagram for experimental test

Figure 31: How the experiment set up in step 1
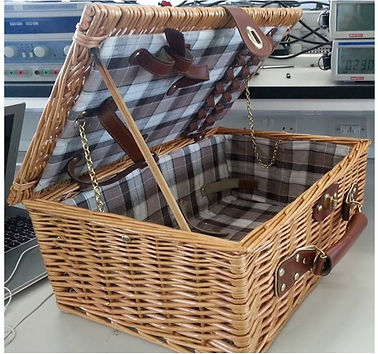
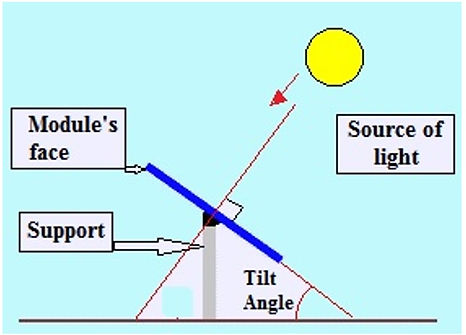
Figure 28: The light arrays must be perpendicular to module’s surface.
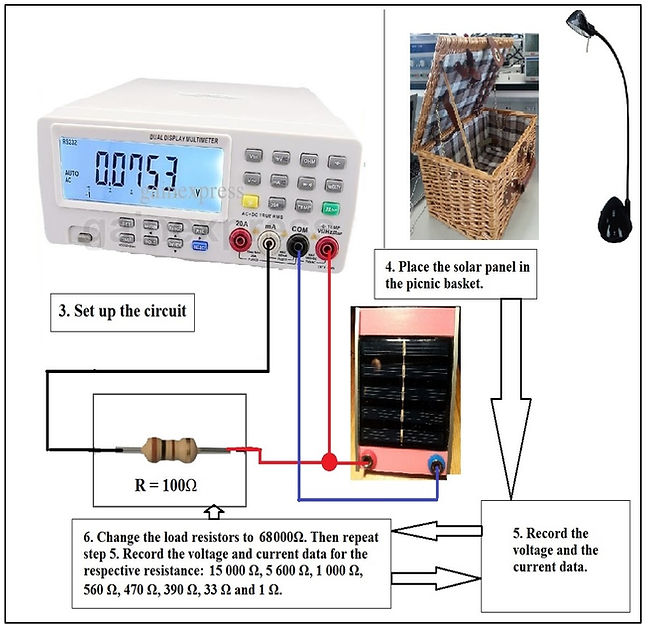
Figure 32: Schematic 2 for the experimental test

Figure 33: How the circuit was set up in step 3 in the laboratory
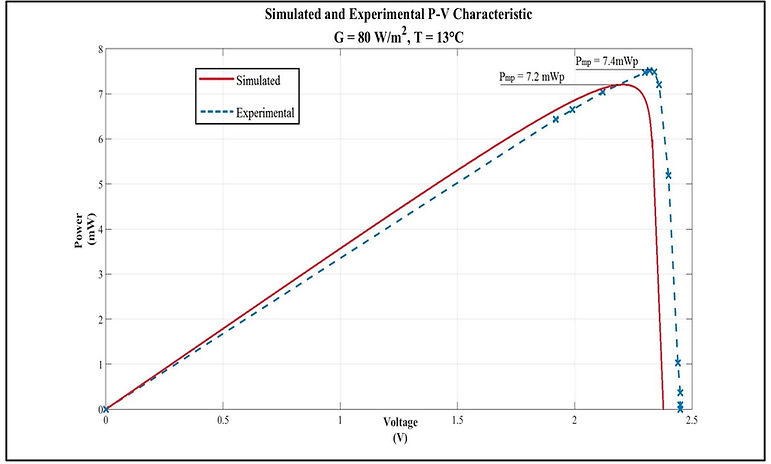
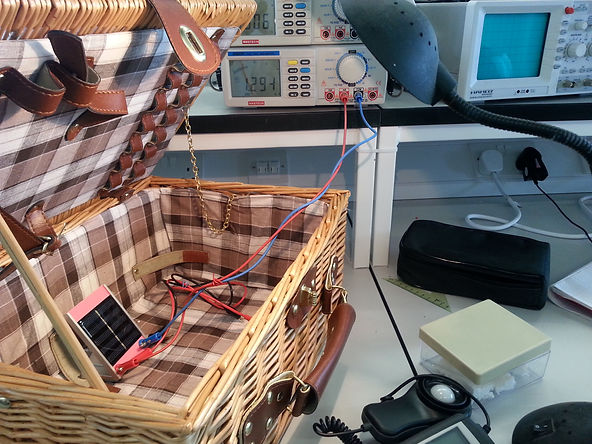
Figure 34: How the experiment set up in step 4
d) Result and Validation

Figure 36: Simulated and Experimental P-V characteristic
Figure 35 & 36 shows that the behaviour of the simulation model is similar to the behaviour of the CK80 module. The output current of the simulated model is slightly smaller than the output current from the experiment, which roughly about 3.4 mA. The output voltage produced in the simulation is also smaller, which is around 2.27 V, compared to 2.4V from the experimental.Thus, the output power from the experiment is larger, which produces the nominal power of 7.4 mWP at temperature of 13°C and the irradiance of 80 W/m².The simulated model gives 7.2 mWp , which the difference between thesimulated and experimental are small.
Overall, the I-V and P-V simulation and experimental results show a good agreement in terms of open circuit voltage, short circuit current and the maximum power. This simulation model can help the prediction the behaviour of any PV cell under different physical and environmental conditions.
FURTHER DEVELOPMENT
This simulation model is a reliable tool for the designer to predict the behaviour of the PV modules. From this simulation model, it can be connected in series and parallel to build a larger PV system so the designers can estimate the output power from the actual PV arrays in real life. In order to make this model more accurately, the developers can investigate the impact of the shunt resistance, which can be added in the model parallel to the diode in the equivalent circuit, so it can reduce significantly the power losses in cell design. In addition, the technician can use this model to investigate how the PV system responses to the different environmental conditions at the particular place, so they can build more efficient solar modules or arrays. Moreover, this model can be added in a complete solar photovoltaic power electronic conversion system in simulation. The final object is developed a general model of PV grid-connected system, which including the inverter, to estimate the amount of generated electricity for the households. This Simulink model does not only help to predict the performance of PV cell, it also can be considered as a smart tool to extract the internal parameters of any solar PV cell including the series resistance, ideality factor which depends on the PV technology, as sometimes these parameters are not always provided by the manufacturers.
The experimental test can also be better developed as the experiment did not take into account the effect of temperature. For the validation test with a better temperature control, the designers can varying the distance between the desk lamp to the solar panel to analyse the irradiance effect on PV module. In addition, the test can be used to import data set to Matlab to create a function of PV system. Furthermore, the test can be done with varying input of temperatures instead of the load resistors to investigate the impact of temperature on the solar cell. The experiment can also be analysed the effect of the tilt angles when mounting the PV system.
Figure 35: Simulated and Experimental I-V characteristic
1. Solar irradiance effect

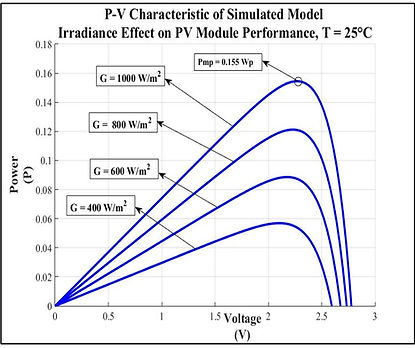
Figure 21: I-V curves for difference irradiance
Figure 22: P-V curves for different solar irradiance
The results shows that the stronger the solar irradiance hits the PV module, the more voltage and electric current generated, hence the more output power produced from the PV module
2. Temperature effect
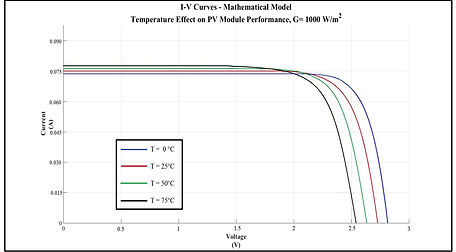
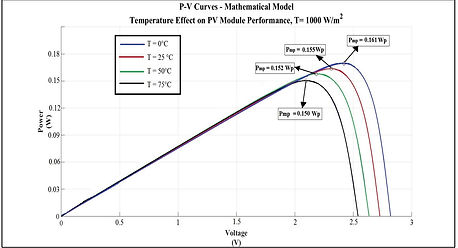
The results shown that hot temperatures can reduce the efficiency of the solar panels.
3. Series resistor effect

Figure 23: Graph of I-V curve- Temperature effect on PV performance
Figure 24: Graph of P-V curves- Temperature Effect on PV performance

Figure 25: Graph of I-V curves – Series Resistor Effect on PV performance.
Figure 26: Graph of P-V curves – Series Resistor Effect on PV performance